


August 3rd, 2026

Hi All,
So, that's July done, phewy 😎
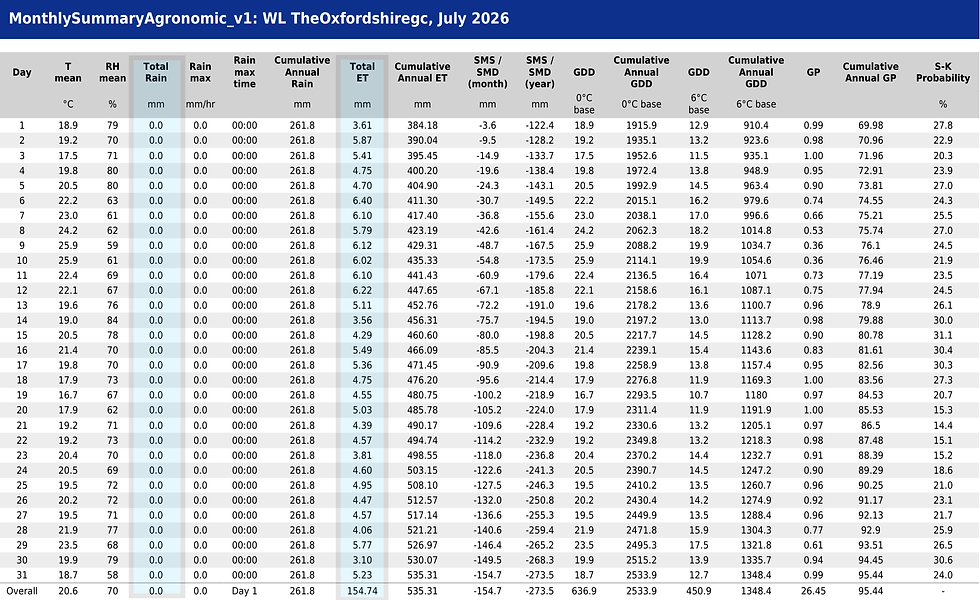
Not just any July, our driest on record in many areas and a parameter that goes unreported by the mainstream meteorological, our highest E.T month for many as well. Looking back at monthly records since 2005 for our default location in Thame, Oxfordshire, July 2026 recorded 154.74mm of E.T loss, surpassing the previous record holders, May 2020 (133.4mm) and July 2018 (133mm) by a considerable margin.
Let's just think about that figure, 154.74mm.
It means the average daily E.T loss in July 2026 was 4.98mm, well above my daily threshold level of 4mm when we normally start to see plant stress.
It means the calculated total moisture lost per hectare was 1,556,014 litres (1,555 m3). Even replacing 50% of calculated E.T loss, that's a lot of water and when it comes to large areas such as outfield, fairways and semi-rough, pretty unsustainable I imagine for all but the most-resourced facilities out there.
Little wonder brown is the new green for summer 2026.
Apart from the question of water as a finite resource for not just amenity, but agriculture as well, there's a price to pay when the plant is subjected to that level of stress.
In a few weeks I am moving house and for the last 7 years I have lived under a magnificent Copper Beech tree. I have watched it strain under the force of winter gales, burst forward into bud in the spring and I have battled a continual deposition of leaves, flowers and fruit over the years. This year is a fruit year and normally we see lots of Beech Nuts raining down from the end of August through September, but with the amount of E.T and plant stress it has been shedding under-developed nuts for the last 2-3 weeks. The tree has 'decided' that the energy and water required to develop fruit is too-high a price to pay this year and sustaining itself into the autumn is more important. When I first looked at my new home, I rolled my eyes. Not at the house, it was lovely, but across the road, yes, you guessed it, was huge Beech tree. My arboricultural love-hate relationship with this tree species is set to continue !
We see the same in agriculture, not self-shedding, but under-developed grains of barley and wheat (screenings) at harvest meaning yields are significantly down. We will see this filter down into increased prices for flour, bread, beer and the like going forward.
In other words there is a price to pay for a summer like this biologically-speaking from a plant physiology perspective.
What I wonder is the price to pay for our grass plant going forward ?
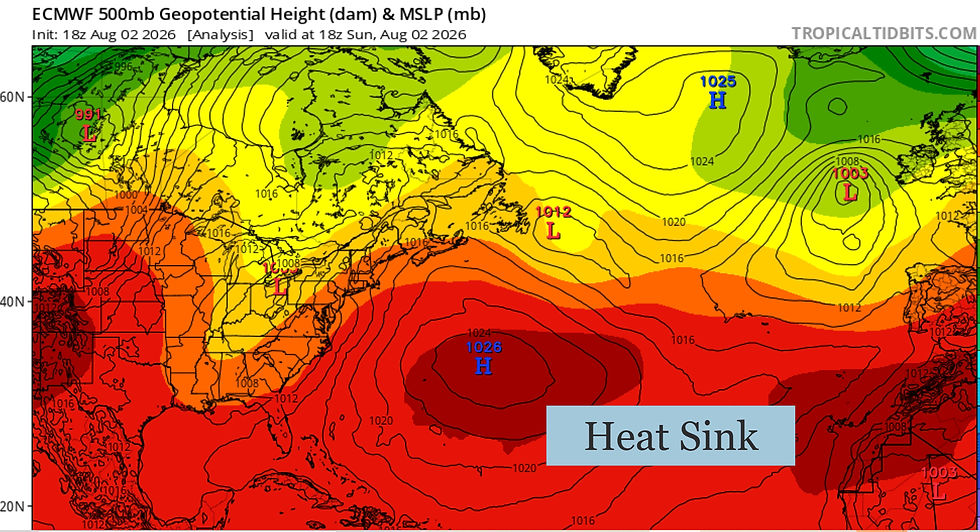
So where are we from a general weather perspective ?
Well first up we still have this 'heat sink' sitting south of us out in the Atlantic and across Africa, Spain and Portugal. This means that if the weather patterns conspire against us, it will feed up warm, hot air to give us heatwave conditions and (worse still I think), it will keep the position of the jet stream way north. In the image above, you can only just see the bottom of the jet stream (dark green line), right at the top of the picture. For us to see long-term change, we have to lose this heat to the south of us and see the position of the jet stream move south. Until we see this, we are stuck in a pattern.

It doesn't mean we will won't see rain, in fact as I type, we have rain moving across Ireland into the north of England and Scotland. There's also some feisty looking rain just off Cornwall tracking towards South Wales. The bulk of the rain is though not for the south and south east of England, though we did see a small amount make it that far on Friday.
There's another process at play as we progress through August and that's of significantly shorter day length and of course increasing night length. My thanks to Rob Hay at Northampton County for reminding me of this.
At the Summer Solstice, June 21st, the day length was 16hrs 55mins, today it is 15hrs 29 mins and by the end of the month, it'll be 13hrs 43mins. Shorter day length means less time for temperatures to rise and for moisture to be evaporated. Indeed when we look at the E.T stats, August E.T is normally 10-30% lower than July's heady heights. That's good news for those nervously looking at diminishing water reserves and / or an ever-accumulating mains water bill. Longer nights also tend to bring more dew as well.

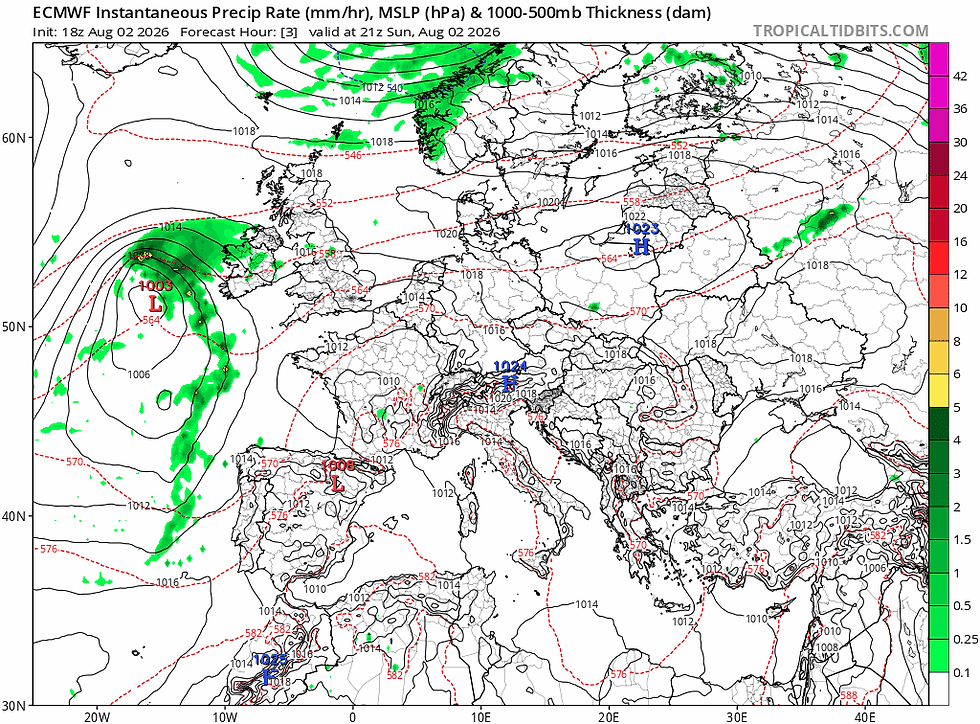
So where is our weather at as we progress into the start of August ?
You'll no doubt have seen the usual sensationalist press headlines proclaiming multiple heatwaves for August, blardy blah blah. The reality is that I see the first half of August being a cycle of short-term heat then replaced by a cooler, more northerly airstream with some rain associated with it. The bulk of this rain will be for the west, north west and north, but I do think some will make it further south and east.
Some, but not a lot, until we see that heat pattern break up and the jet stream position sink south. So this week we have warmer temperatures at the beginning of the week but as low pressure passes across the U.K, it'll do that familiar trick of dragging down cooler, north westerly winds on its trailing edge. The pattern looks to repeat again next week with high pressure re-establishing over the weekend, temperatures lifting again at the start of next week before a new low pressure may push down from the north. Again that low pressure will have moisture associated with it. I can see the same pattern for Ireland and Denmark, with the same low pressure cooling things down and bringing some rain before temperatures pick up again and then cool down again, with the threat of rain or should I say, a welcome chance of rain :)
Agronomic Notes
Above is the monthly agronomic summary from Prodata Reports for our default location encompassing July 2026. The two columns I have highlighted feature total monthly rainfall (0mm) and total monthly E.T (154.74mm), so the soil moisture deficit was -154.74mm, that's over 6" in old money.
My first thought was to look at some of more recent heatwaves / dry summers, namely 2018, 2020, 2022 and 2025 and see how they compare. I mean even that last sentence should tell us something shouldn't it. There's a theme here eh ?
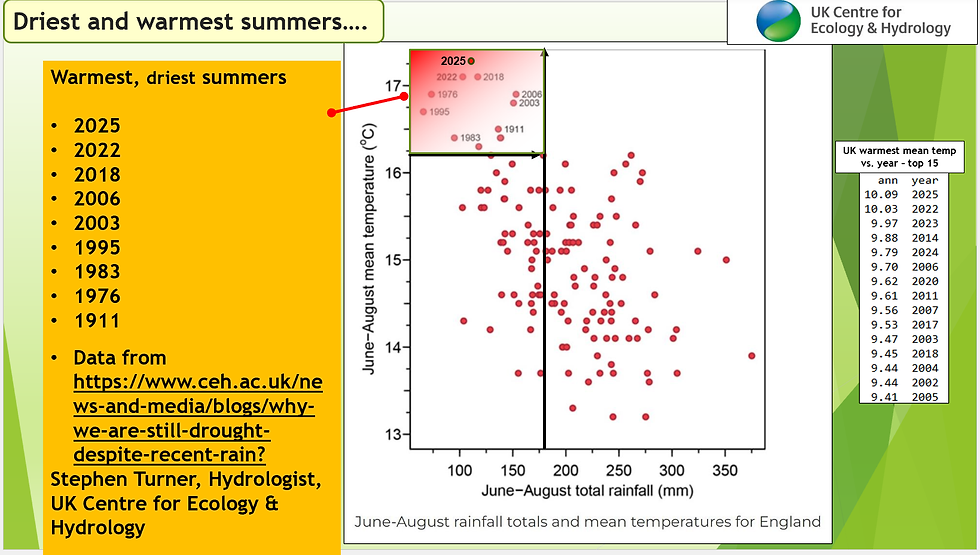
Lifting a slide from one of my presentations and using data from the UK Centre for Ecology and Hydrology, we can see a list of not only our warmest summers but also our driest as well. Of course we will be adding 2026 to this list, so that means over the last 5 years, 3 of them have fitted this criteria. What isn't shown is that the summers of 2020 and 2022 both featured significant heat and dry spells with high monthly E.T totals.
So we are encountering this set of events more frequently. It should therefore be on our radar in terms of mitigating strategies. How do we design and maintain our facilities better to be able to withstand the heat but also the drought ?
The summer of 2026 should serve as another wake up call in how we address these matters as an industry and as a facility. We need to learn from our experiences and plan for the future, one that will almost certainly contain more water restrictions.
Let's drill down into the stats and see why this year has been such a tough challenge for us.

The first thing we can see is that only January and February came in with a soil moisture surplus, so by March we began losing soil moisture from the profile as moisture loss by evapotranspiration exceeded moisture received by rainfall. This pattern has continued unbroken through April, May, June and July and if it wasn't for a wet and cool start to June 2026, we would be in an even worse situation. So the need to irrigate has been with us since the start of the spring with only a brief respite at the beginning of May and June.
What tipped the balance was July, with many locations recording no rainfall at all in common with our default Thame location. In combination with no rain, we also recorded our highest monthly E.T total since I started reviewing these stats in 2005. I can't comment for the great drought of 1976 because although there is local rainfall data available from The Met Office, there is no E.T data.
If we compare 2026 y.t.d with previous years, you can see how it stands up...

Above is a graph showing the cumulative effect of rainfall vs. E.T.
So we start the year in surplus as one would expect from the winter rainfall, but by March we are declining in terms of soil moisture surplus. Normally this decline starts in April. By April we are just about in surplus. Now both May and June started cool and wet and finished hot and dry with record heat, so actually by the end of June we weren't looking as bad as previous hot, dry years with a soil moisture deficit of -118.8mm. Compare that with the previous year when we were at -183.2mm.
Again we can see that July's weather did the real damage with minimal / no rainfall and record moisture loss by E.T. So look on the bright side because it could have been much worse at this stage if we hadn't had started May and June, wet and cool. So if your management wants to know why things are looking on the back foot, dry, brown and crispy, despite irrigating, there's the reason.
So how will this play out for the rest of the summer leading into the autumn ?
There's a lot to consider here.
First up, we know that at high air temperatures, our C3 cool season grasses are on the back foot. As the air temperature increases over 25°C, the efficiency of the photosynthetic process declines, so making energy to support growth reduces. At the same time, the energy-intensive processes involved in respiration within the grass plant increase, so the plant is using more energy than it produces leading to a deficit. That is why growth rates decline at higher temperatures and why the Growth Potential formulae takes this into account with an optimal temperature for growth and a sub-optimal adjustment for higher temperatures.
So theoretically the effect of prolonged high E.T / air temperature days is to put the plant in an energy-deficient status and under stress. I say theoretically because the reality is even in this summer that the true heatwaves (as opposed to ever day is a heatwave according to our daily newspapers) are short-lived. Temperatures drop back and the plant is able to re-adjust and recover provided it receives irrigation / rainfall and is helped along the way by some fine-tuned best management practices. If it doesn't, it doesn't recover.

I was reminded of this fact by an image that dropped into my Inbox early this morning as I emerged from yet another night of crap sleep with bleary eyes, reluctant to acknowledge daylight :) (thanks Sean)
In it you can see some 12mm (1/2") cores pulled from some mature USGA-spec, bentgrass / Poa greens. I know these greens very well, I spent many years sampling these greens and monitoring root growth. The image above are by far the best set of roots I have seen and probably reflect my lack of involvement since leaving my previous employment 😀
On a serious note, it is nothing to do with me, it's a reflection of balanced nutrition, good surfactant, irrigation management (despite like many possessing an old and inefficient irrigation system) and some nicely-timed applications of products to mitigate stress, biostimulants, PGR's and phosphites amongst them.
So, we have lots of finely-branched roots here, reflecting a grass plant that has maximized its moisture and nutrient uptake. Incidentally, I do smile at these pictures showing mega root length when the reality is they're usually taken during grow-in and the focus is on root length. For me, root mass is key and that's what I see here.

So it is going to be interesting to me to see how we fare this month agronomically.
I often say 'A is for August and A is for Anthracnose' and after numerous heat spikes and Anthracnose triggers this summer (see image above from our Prodata Reports Software), one would expect disease pressure to be high. I also take this in part as a measure of disease pressure for Dollar Spot as well and again I wonder what awaits us as nights lengthen and dew events become more frequent. Plant leaf wetness is the driver here.
So one train of thought is that after a summer of prolonged heat stress and significantly following July 2026, the potential for Anthracnose, Dollar Spot and Microdochium following on is high. That would be the logical deduction.
I question this though because when I see those core plugs above and note not just the excellent root mass (yes I know they won't all be like this) but the fact that by coring this month, the greens are getting a welcome input of oxygen and the ability to 'vent'. The importance of providing the grass plant an opportunity to breathe and develop more root mass should not be under-estimated.
I remember once going to a course affected by a high level of Anthracnose and as I walked around the greens I came across one with very little.
Why the difference ?
Well this particularly green had been vertidrained in July before the Anthracnose appeared and I am convinced to this day that it was this deep venting that produced a stronger, healthier plant, more able to resist disease ingression.
So, it may not necessarily be a doom and gloom scenario that awaits us, maybe if we have been able to provide the correct inputs at the correct time, the grass plant may emerge stronger rather than weaker and it will prevail rather than suffer. Time as usual will be our judge.
All the best.
Mark Hunt


Totally agree with your observations Mark - I've noted the same and for me, short-rooting = high risk of anthracnose, especially after a wet winter with continued play (more compaction) followed by a hot, dry summer where regular competitions have likely minimised the necessary remedial aeration. With many clubs doing renovations in August, it might be a little late to reduce the risk of anthracnose and the sand blasting and increased humidity could heighten risk....I'm not usually a 'doom and gloom' merchant but I'd certainly be cautious/ vigilant this year if you have noticed your rooting is reduced and your aeration programme since spring has been minimal. :)